Sign in
Home
How to Measure Reproducibility in an LNP Screening Workflow
By Joshua Gomes
Measure reproducibility in an LNP screening workflow by comparing independent preparations within and across runs under matched handling, so differences between candidates can be separated from workflow variation.
Look for consistent results within and across runs
When lipid nanoparticle (LNP) candidates are prepared on different days, a shift in the workflow can look like a difference between candidates. Preparing the same formulation again, both within a run and in a separate run, shows whether a difference comes from the formulations or from the workflow.
An independent preparation is a new formulation of the same composition that goes through every formulation and handling step again, unlike repeat measurements of a single sample.
| Type of repeat | What it tells you |
|---|---|
| Repeat measurements of one sample | Whether the measurement itself is repeatable |
| Independent preparations within one run | Whether the workflow produces the same particles under one setup |
| Independent preparations across runs | Whether results hold when the workflow runs again on another day |
No single size or %CV threshold defines reproducibility, because the variation your screen can tolerate depends on how small a difference between candidates it needs to detect.
Read particle size, PDI, and %CV together
Z-average diameter is the average hydrodynamic size measured by dynamic light scattering (DLS). Polydispersity index (PDI) describes how broad the size distribution is within a sample. Particle-size percent coefficient of variation (%CV) expresses the standard deviation of Z-average across independent preparations as a percentage of the mean.
| Result | What to look for across independent preparations |
|---|---|
| Z-average diameter | The same formulation returns to a similar size within and across runs |
| PDI | The size distribution stays comparably narrow |
| Particle-size %CV | Size variation stays low, with the number of preparations and runs stated |
Each preparation can have a low PDI while its average size still shifts between runs, so no single result confirms reproducibility on its own. A %CV from a single run leaves out run-to-run variation. None of these results measure encapsulation or biological activity, which need their own assays.
Match formulation and handling conditions across runs
A shift in particle size between runs often comes from differences in preparation, mixing, or post-processing, rather than from the formulation itself. A sample measured right after collection and one measured after buffer exchange cannot be compared directly.
| Comparison point | What to keep consistent |
|---|---|
| Formulation inputs | Composition, concentrations, buffers, and how inputs were prepared |
| Formulation method | Platform, device, and protocol settings |
| Processing and sample age | Processing stage, storage, and hold times |
| Characterization | Sample preparation, measurement timing, and analytical method |
Record these conditions with every result. When they differ, repeat the comparison under matched conditions before drawing a conclusion.
Decide which differences support advancing a candidate
Reading the results together shows which differences between candidates are worth acting on.
| What you see | What it means | Next step |
|---|---|---|
| Preparations agree within a run but shift between runs | Something in the workflow changes between days | Compare candidates within the same run, or repeat one formulation in every run as a reference |
| PDI stays low while Z-average shifts | Distributions are tight, but average size is not reproducing | Treat small size differences between candidates as unconfirmed |
| Candidates differ by about as much as repeat preparations | The difference may come from the workflow | Confirm in another independent run |
| The difference holds across runs under matched conditions | The difference reflects the formulations | Advance, and confirm with encapsulation and biological assays |
| Samples were processed or measured differently | The comparison is not on the same basis | Repeat under matched conditions |
Most of these patterns resolve with another independent preparation.
Make independent preparations practical in routine screening
Every independent preparation uses instrument time, operator time, and material that could go toward new candidates. How much effort it takes to prepare a formulation again decides how often your team can afford to confirm a result.
| Routine task | What to assess |
|---|---|
| Preparing another formulation | Setup and operator time repeated for each preparation |
| Moving samples between steps | Manual transfers and waiting between instruments |
| Collecting material for analysis | Enough recovered volume for characterization and follow-up assays |
| Repeating the workflow on another day | Whether others on the team can run the method the same way |
For teams already preparing reagents on a liquid handler, integrating formulation and collection removes transfers to a separate instrument. Less time per formulation leaves room for more independent preparations and more candidates.
Bring controlled LNP formulation onto your liquid handler
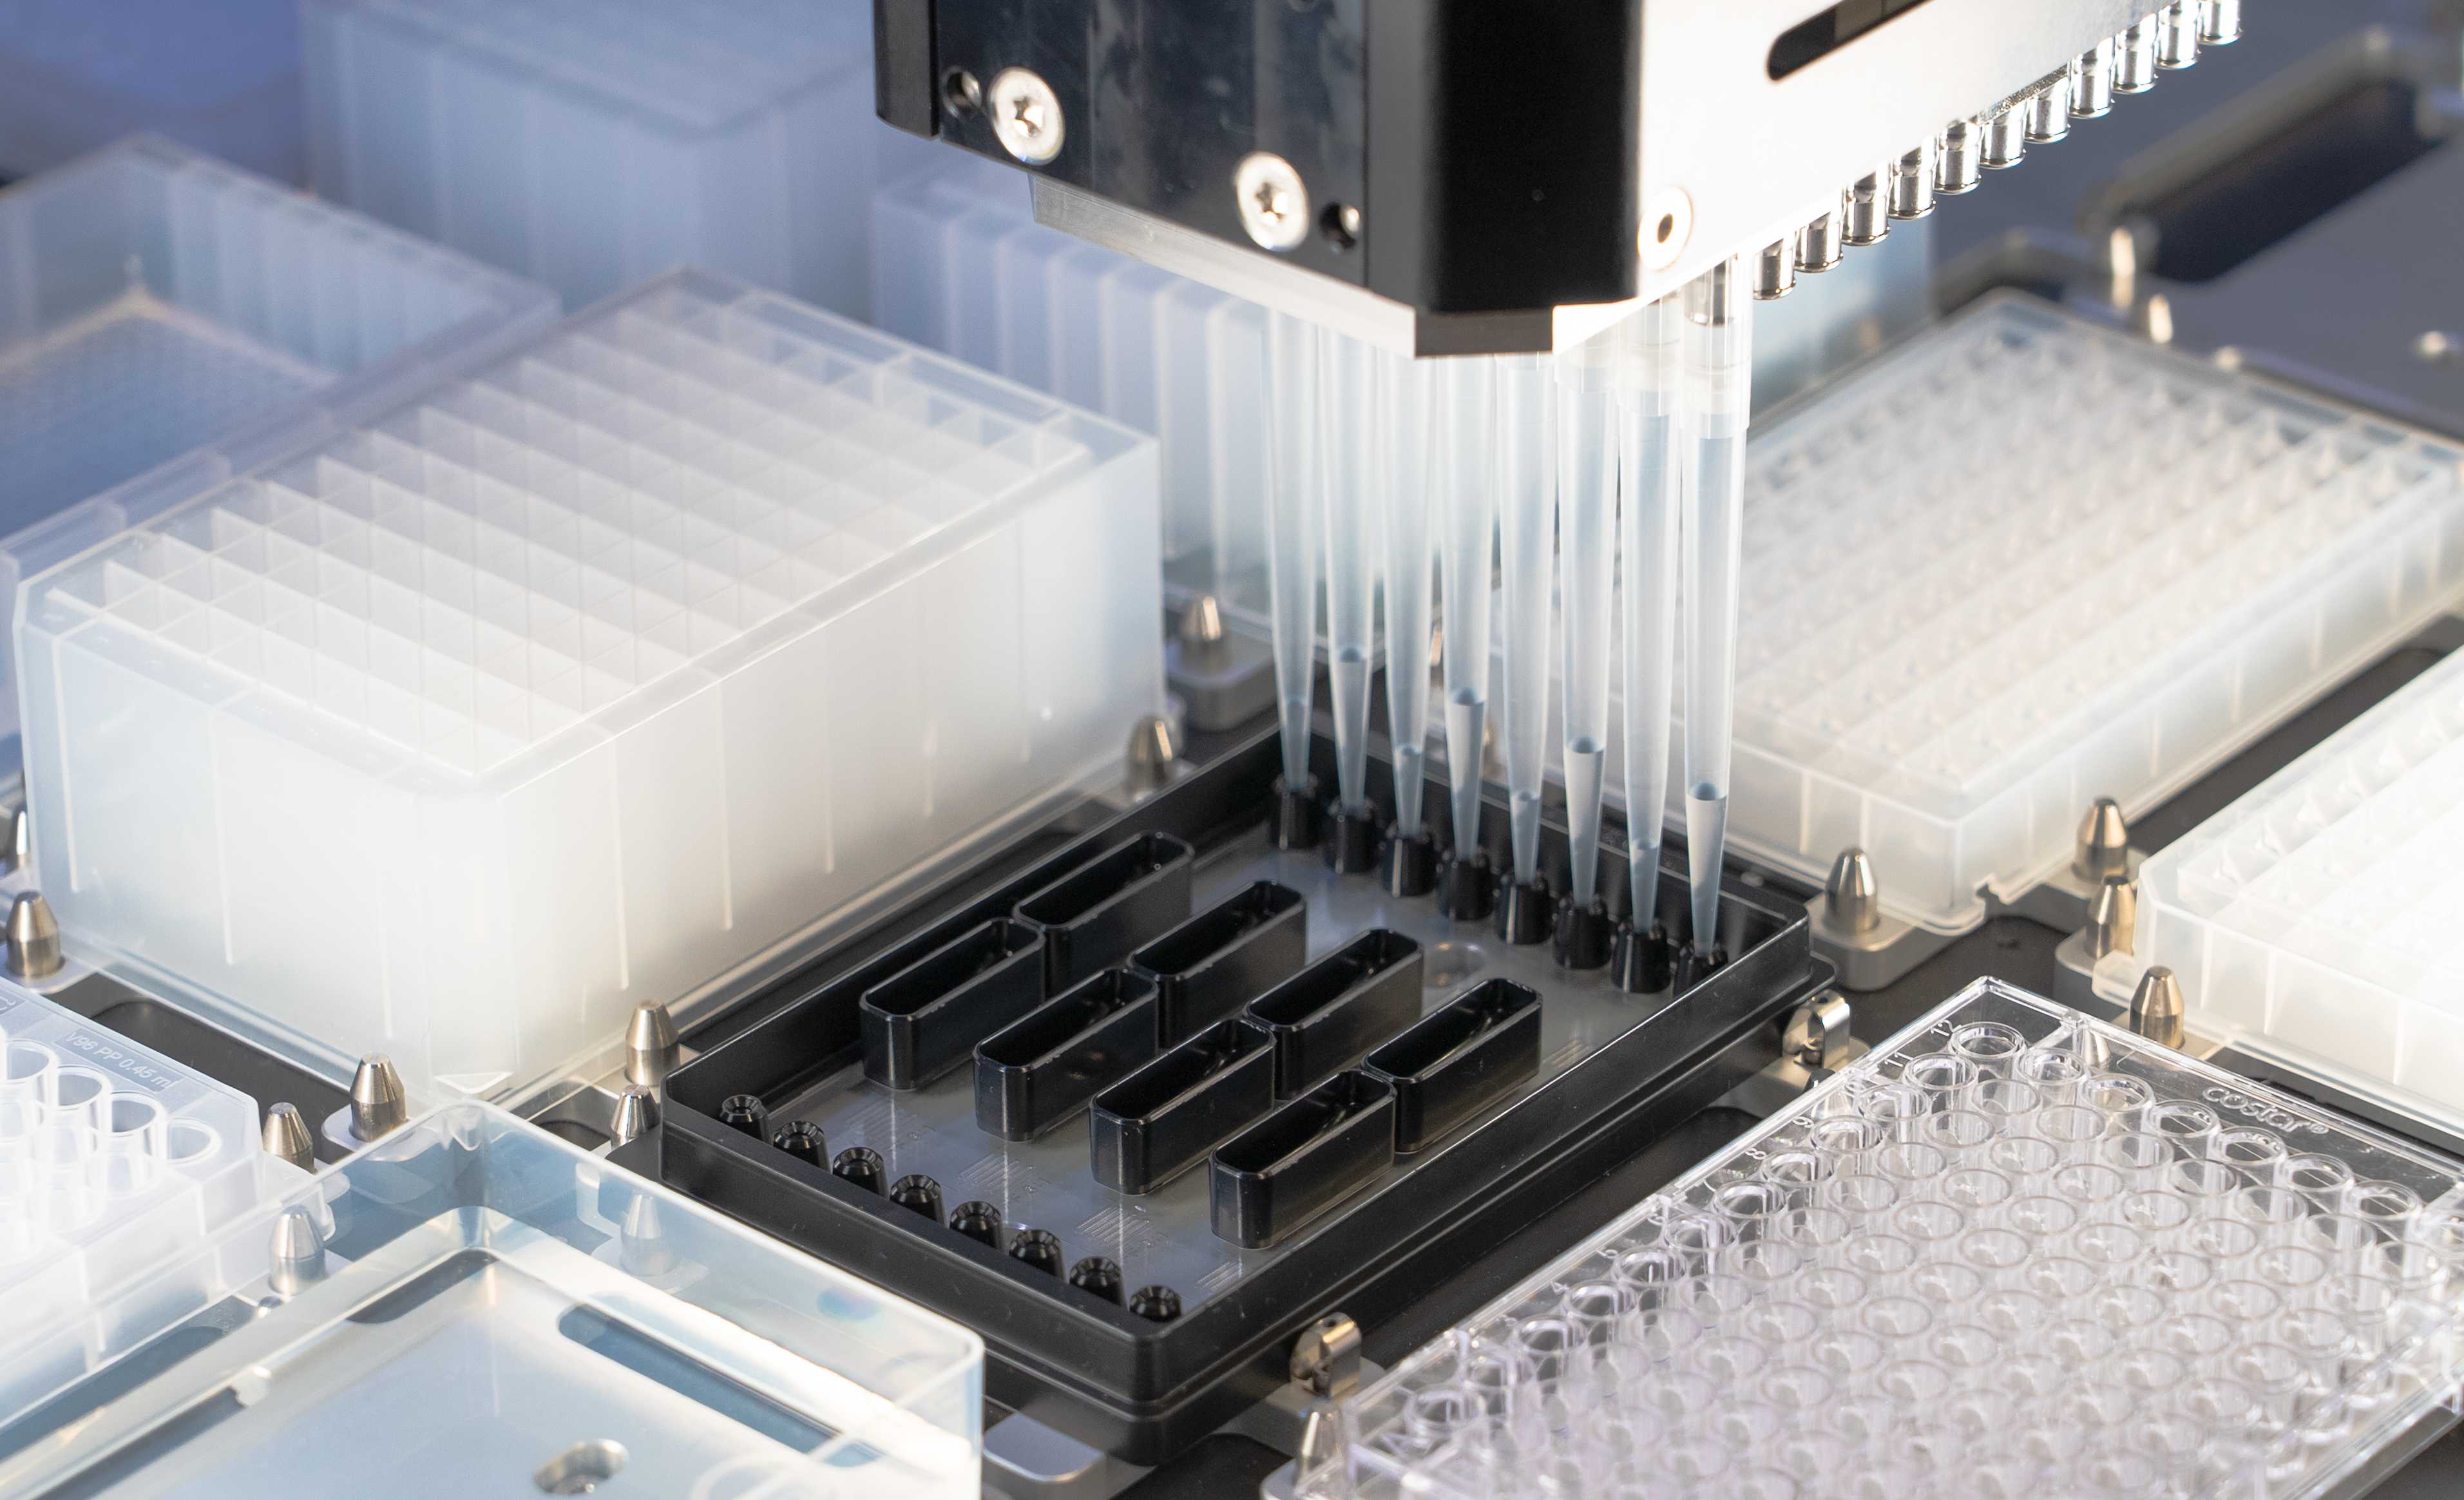
The LNP Screening Array runs microfluidic formulation on your liquid handler, with reagent delivery, mixing, and collection in one automated sequence. Every independent preparation follows the same protocol and is collected separately for characterization.
| Screening requirement | How the LNP Screening Array addresses it |
|---|---|
| A consistent mixing path | Every formulation runs through the same microfluidic mixer design |
| Defined liquid delivery | A platform-specific automation protocol sets the volumes and flow rates for every sample |
| Fewer transfers between instruments | Formulation and collection stay on the liquid handler deck |
| Matched timing after mixing | Every sample follows the same schedule from mixing to collection |
Evaluate reproducibility with your own formulations
Run an evaluation in your lab with your own formulations on your liquid handler.
Our applications team is on site for the first run, runs DLS with you, and reviews results against your current method.