Sign in
Home
How to Evaluate an LNP Screening Platform
By Joshua Gomes
Compare LNP screening platforms on the time and material required to complete a screen, consistency across independently prepared samples, and compatibility with existing automation.
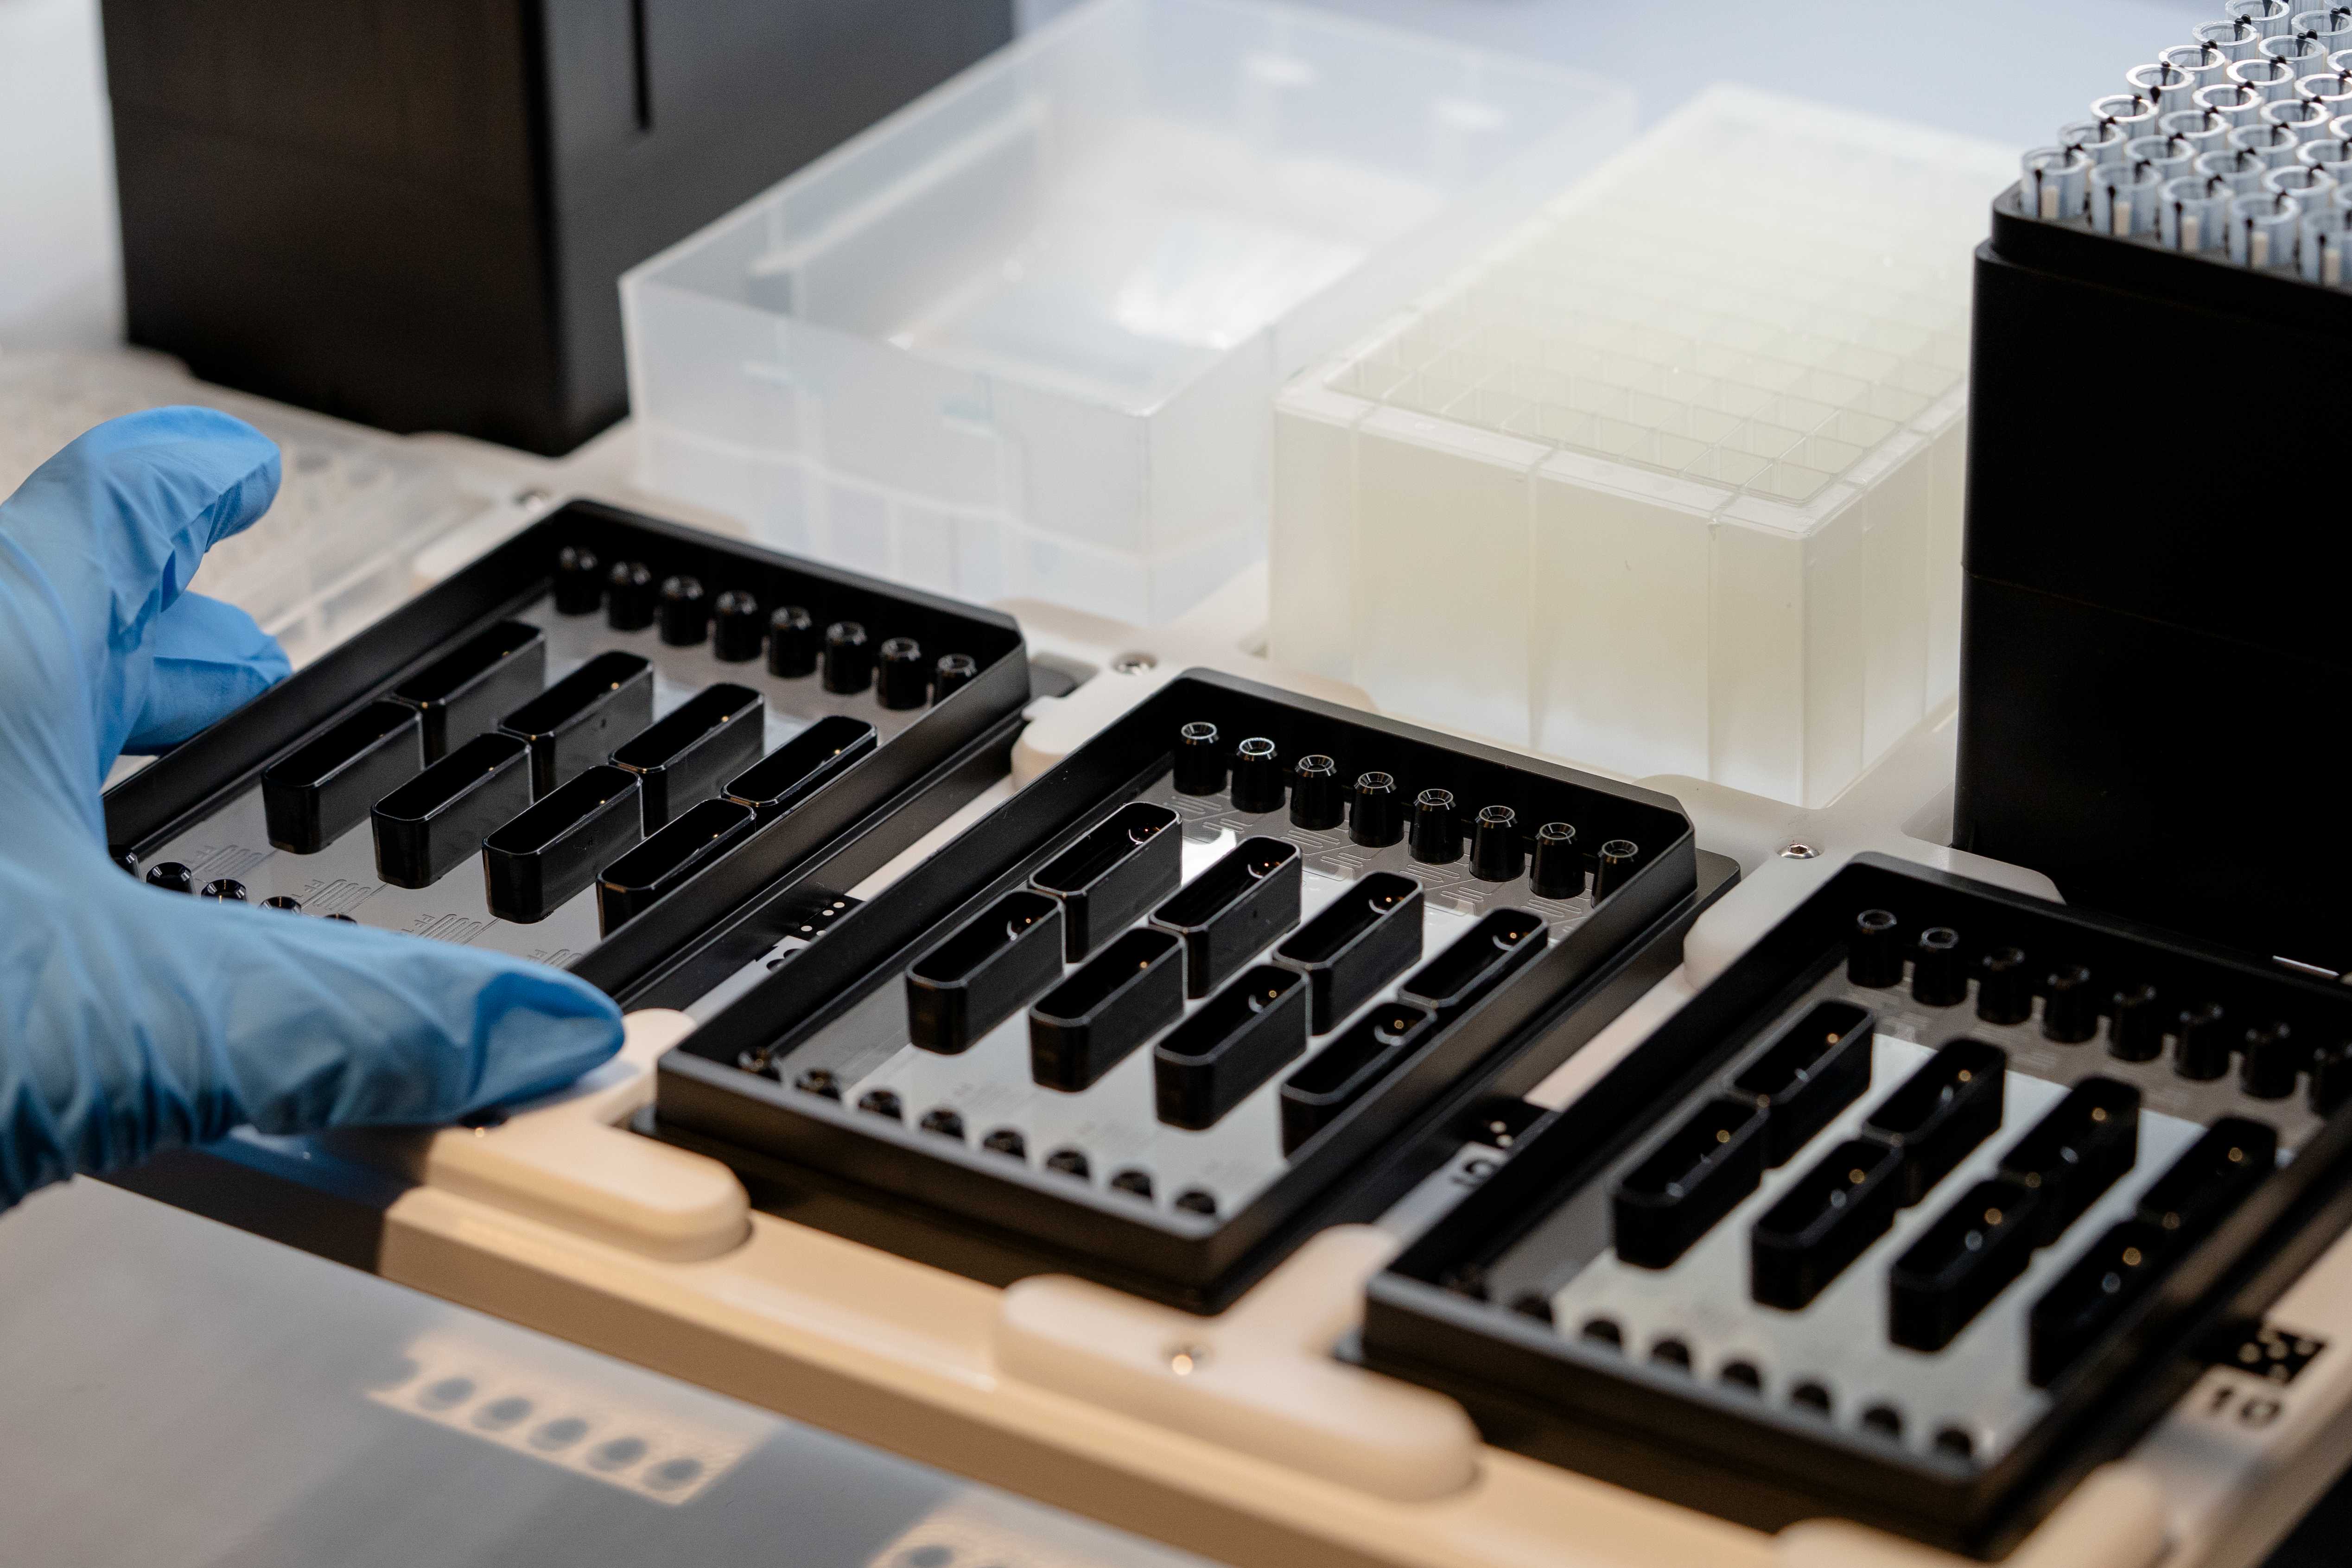
Evaluate performance across the full screen
Particle size and polydispersity index (PDI) can provide a useful starting point, but those measurements alone do not establish whether a platform can support a broader screen. As conditions and replicates are added, throughput, material use, and consistency across the run can affect how much a team can test and how confidently the results can be compared.
Define the screen you need to run
When evaluating an LNP screening platform, teams should first define the number of samples they plan to prepare, including controls and independently prepared replicates, and the amount needed from each. Comparing platforms at the planned sample count, recovered volume, and concentration provides a consistent basis for evaluating the time and material required to complete the screen.
| Screening requirement | What to specify |
|---|---|
| Total samples | Number of distinct conditions, controls, and independently prepared replicates |
| **Sample required downstream ** | Recovered volume and concentration needed for the planned readouts, measured at the same processing stage |
| Available lipid and cargo | Amount available for the full screen, including material used during setup or lost before collection |
| Formulation variables | Lipid composition, cargo, buffer conditions, and mixing settings the platform needs to accommodate |
| Existing automation | Liquid handler model, pipetting configuration, and available deck space |
For example, a throughput figure generated at 50 µL per formulation would not translate directly to a screen that requires 250 µL per sample, where formulation time and input requirements may differ.
Compare time per formulation across platforms
Throughput specifications may describe the formulation step alone. Loading, priming, collection, and transfers repeat for each sample or run, and those steps can account for much of the time required to complete a screen.
Throughput should be reported as samples collected per hour at the target volume, with elapsed time measured from loading prepared inputs to collecting the final sample. For platforms that prepare several formulations in parallel, the batch size and full cycle time are also needed to interpret an average time per formulation.
| Throughput factor | What to compare |
|---|---|
| Time per formulation | Time to formulate and collect a single sample at the target formulation volume |
| Samples per unit time | Number of samples completed per hour at the target volume |
| Priming and equilibration | Time and volume required before the first usable sample |
| Changeover and device exchange | Time required between runs and whether those steps need manual intervention |
| Hands-on time | Operator time required for loading, collection, transfers, and changeover |
| Total elapsed time | Time from loading prepared inputs to collecting the final formulated sample |
Across a 96-formulation screen, a 30-second manual transfer performed separately for each sample would add 48 minutes of hands-on time. Measuring total elapsed time and hands-on time separately can help teams understand when formulation will finish and how much scientist time the run requires.
Compare material required per formulation
The target formulation volume accounts only for the sample intended for collection. Priming, dead volume, and transfer losses can increase the lipid and cargo required per sample, and that total determines how many samples a fixed quantity of input can support.
| Source of material consumption | What to compare |
|---|---|
| Lipid and aqueous input | Total volume and concentration of each phase required, including overage and priming material |
| Dead volume | Material retained in the mixer and tubing after collection |
| Transfer loss | Material left in source wells, tips, or transfer vessels, excluding losses already counted in the fluid path |
| Recovered sample | Volume and concentration available for characterization and downstream testing |
Recovered volume should be considered alongside cargo concentration at the same stage of processing. For RNA formulations, high encapsulation efficiency can coexist with low overall recovery because it describes the fraction of RNA encapsulated in the measured sample, rather than the proportion of starting RNA recovered.
For teams working with newly synthesized ionizable lipids or limited cargo, higher material recovery per sample can allow more compositions, ratios, or replicates to be screened from the same input. A platform’s minimum formulation volume also affects material use, since teams may need to prepare more sample than their downstream testing requires.
Input cost per sample is covered in What Determines the Cost per LNP Formulation?
Compare size and PDI across repeated formulations
Consistent size and PDI across repeated formulations help teams distinguish differences between screening conditions from variation introduced by the workflow. That consistency needs to be assessed using independently prepared samples, since repeated dynamic light scattering (DLS) measurements from one sample primarily show analytical repeatability.
| Performance evidence | What to compare |
|---|---|
| Independent replicate formulations | Individual size and PDI results and their spread, with the number of independently prepared samples stated |
| *Controls throughout the run | Consistency of the same control near the start, middle, and end of the run and across mixer positions where applicable |
| Separate devices and runs | Consistency across devices and independent setup cycles, with additional consumable lots assessed as the evaluation expands |
| Formulation and handling conditions | Lipid composition, cargo, mixing settings, formulation volume, buffers, and timing of dilution or buffer exchange |
Size and PDI should also be compared under consistent dilution and measurement conditions, since sample preparation, dust, and aggregates can affect the DLS result. Keeping those steps consistent helps reduce variation from sample handling and analysis, making it easier to judge the consistency of the formulation process.
Consistent size and PDI do not establish whether a formulation encapsulates its cargo effectively or delivers it to the intended cells. Encapsulation efficiency and relevant biological assays should therefore be included when those results determine which formulations advance.
Compare what equipment each platform requires
Formulation equipment determines whether a screen can run on the automation a lab already has, and what has to be installed and maintained before the first sample. Benchtop systems may not automate loading and collection, so the comparison should also account for the transfers and operator steps required by the specific setup. On-deck formulation keeps reagent delivery, mixing, and collection within the liquid handler, provided the device and protocol are compatible with the configuration in use.
| Workflow requirement | What to compare |
|---|---|
| Where formulation occurs | Whether formulation runs on the existing liquid handler or on a separate instrument that requires installation, training, and maintenance |
| Supporting hardware | Pumps, tubing, pressure controllers, and other components that add setup and maintenance |
| Compatibility with existing automation | Liquid handler model, pipetting configuration, and available deck space |
| Where samples enter and leave automation | Whether samples remain on deck or move between instruments, and whether those transfers are manual or automated |
| Automation protocol | Whether a protocol exists for the liquid handler and configuration in use, or must be developed |
Compatibility should be confirmed against the configuration installed in the lab, since pipetting technology, deck layout, and software configuration can differ between installations. This includes verifying the required tips, labware, and automation protocol, as well as whether the liquid handler has sufficient capacity alongside the lab’s other work.
The differences between benchtop systems and on-deck formulation are compared in LNP Screening Array vs. Benchtop Systems.
Test the platform with your own formulations
Published specifications can help you identify platforms worth evaluating, but they do not establish how a platform will perform with your lipids, cargo, buffers, target volumes, and screening requirements. Testing representative formulations alongside a known control, with readouts and acceptance criteria defined before the run, provides evidence under the conditions you intend to use.
| Evaluation requirement | Define before the run |
|---|---|
| Formulations | Representative lipid and cargo conditions from the program |
| Volumes | Target formulation volume and minimum recovered sample needed for downstream testing |
| Throughput | Number of samples to prepare and the time available to complete formulation and collection |
| Automation | Liquid handler, pipetting configuration, deck setup, and protocol needed for the evaluation |
| Readouts | Particle size, PDI, encapsulation efficiency, and any planned biological assays |
| Acceptance criteria | Agreed targets for particle characteristics, recovery, material use, and throughput |
Evaluate the LNP Screening Array in your workflow
With your screening requirements defined, use your own formulations to evaluate the LNP Screening Array in your lab. The LNP Screening Array brings microfluidic formulation onto liquid handlers in a standard SLAS microplate format, so reagent delivery, mixing, and sample collection stay on deck.
An evaluation runs on a protocol matched to your liquid handler and pipetting configuration. Using your own lipids and cargo, you measure elapsed and hands-on time, material use and recovery, and consistency across independently prepared replicates against the criteria established before the run.
Request an evaluation
The Starter Kit includes LNP Screening Arrays, an automation protocol matched to your liquid handler, and in-person training to run the evaluation on your instrument.