Sign in
Home
How to Compare LNP Formulations During Screening
By Joshua Gomes
Compare LNP formulations using particle size, PDI, and other readouts matched to your screening goals, with consistent sample preparation and independent replicates to identify which candidates warrant further testing.
Define what your LNP screen needs to show
A lipid nanoparticle (LNP) screen should help you decide which formulations meet your preliminary requirements and warrant further testing. Particle size and polydispersity index (PDI) provide a starting point, while the readouts you add depend on whether the screen needs to establish cargo encapsulation, material recovery, or functional delivery.
Before generating samples, connect each attribute the screen needs to establish to the readouts that answer it.
| Screening attribute | Readouts that address it | Why it matters to the screen |
|---|---|---|
| Particle size and uniformity | Z-average diameter, PDI | Sets the physical baseline for every candidate |
| Formulation reproducibility | Z-average diameter and PDI %CV across independent preparations | Shows whether a result holds before a candidate advances |
| Cargo encapsulation and availability | Encapsulation efficiency, concentration, recovery | Confirms cargo encapsulation for deliverability and dosing |
| Biological response | Protein expression and cell viability in a defined cell model | Shows whether particle and cargo results translate into function |
Compare candidates under consistent conditions, so differences in their results can be interpreted on the same basis.
Zeta potential, which reports surface charge, is often measured alongside size. Cryo-electron microscopy (cryo-EM) and small-angle X-ray scattering (SAXS) resolve morphology and internal structure, but their cost and turnaround usually reserve them for a shortlist.
Start with particle size and PDI
Size and PDI give every candidate a common physical baseline. When samples are measured by dynamic light scattering (DLS), the Z-average diameter provides an estimate of average hydrodynamic particle size. PDI adds context to that average by indicating how narrow or broad the size distribution is within the sample.
Two candidates may have nearly identical Z-average diameters while differing in the breadth of their size distributions. Homogeneity can impact downstream formulation performance, so it is important to read size and PDI together when determining whether a candidate should move forward.
Each readout plays a distinct role in that decision.
| Readout | What it shows | How screens use it |
|---|---|---|
| Z-average diameter | Average hydrodynamic particle size | Checks each candidate against the size range the application requires |
| PDI | Breadth of the size distribution within one sample | Flags candidates whose average hides a broad or mixed population |
The size range and PDI criteria for advancing a candidate should reflect the intended application. Smaller particles or a lower PDI do not, on their own, establish that a candidate is better suited to the next stage of testing, and neither value shows whether the cargo is encapsulated.
Measure cargo encapsulation and recovery
For cargo-loaded formulations, encapsulation and recovery determine whether a candidate carries enough cargo into biological testing to produce a measurable response.
| Readout | Question it answers | What to record with it |
|---|---|---|
| Encapsulation efficiency | What fraction of the total measured cargo is encapsulated | Cargo type, assay method, and purification stage |
| Concentration | How much cargo is present per unit volume | Whether the value refers to RNA, lipid, or particles |
| Recovery | How much of the input cargo remains after processing | Input amount, recovered volume, and stages compared |
Concentration and recovered volume, with assay dilution accounted for, establish the amount available for downstream work. Comparing that amount with the defined input establishes recovery, so a sample may show high encapsulation efficiency while retaining only a small fraction of the original cargo load, which is why these readouts are reviewed together against the material needs of the next experiment.
Prepare independent replicates to check consistency
A formulation that meets your particle and cargo requirements is worth investigating further, but one successful preparation does not establish that the result can be repeated. The same formulation can produce a low PDI each time while its average particle size shifts between preparations.
What a replicate establishes depends on which steps are repeated to produce it.
| Replicate type | Steps repeated | What the spread in results shows |
|---|---|---|
| Repeat reading of one sample | The measurement only | How consistently the instrument measures that sample |
| Independent preparation | Formulation, collection, and measurement | How consistently the workflow produces the formulation |
For particle size, percent coefficient of variation (%CV) summarizes how much Z-average diameter or PDI varies relative to the mean across independent preparations. Average the repeated readings within each preparation before calculating %CV across preparations, so additional readings of one sample are not counted as additional preparations.
For cargo-loaded formulations, also compare encapsulation efficiency and recovery across independent preparations, because consistent particle size does not establish consistent cargo encapsulation or recovery.
Setting the number of independent preparations per candidate before the screen starts keeps a single strong result from deciding the selection. Reporting whether each replicate is a separate preparation or a repeat reading shows reviewers what a %CV reflects.
For the sources of variation these replicates capture, see What Causes Variability in LNP Formulation?
Prepare and measure samples under the same conditions
Candidate differences can be attributed to the formulation only when every sample is prepared, stored, and measured the same way. When one candidate is measured immediately after collection and another after buffer exchange or storage, differences in their results may come from processing or sample age as well as the formulation conditions being tested.
Keeping these conditions consistent, or reporting them when they differ, separates processing effects from formulation effects.
| Comparison point | What to keep consistent or report |
|---|---|
| Processing stage | Whether samples were measured before or after dilution, buffer exchange, concentration, or storage |
| Sample handling | Diluent, preparation procedure, storage conditions, and time from formulation to measurement |
| Analytical method | Measurement temperature, instrument settings, assay procedure, and data analysis |
Hold these conditions constant while varying the formulation factors under investigation. When studying a processing step, measure candidates at matching points before and after it, and report the processing stage and measurement conditions alongside the results.
Test biological activity to assess functional delivery
Particle size, PDI, and encapsulation do not establish whether cargo produces the intended biological response, so screens selecting for functional delivery also need a biological assay.
For mRNA-loaded LNPs, protein expression provides a functional readout of delivery and translation in the tested cell model. Because formulations with similar particle characteristics and encapsulation efficiency can produce different expression levels, compare candidates carrying the same mRNA under matched assay conditions.
Interpreting those differences depends on defining the conditions under which each formulation is evaluated.
| Comparison point | What to define |
|---|---|
| Cell model and timing | Cell type, passage range, seeding density, exposure conditions, and time between treatment and measurement |
| Dose basis | Whether formulations are compared at matched amounts of total or encapsulated RNA, since that choice can affect their relative performance |
| Controls and visibility | Untreated cells, an appropriate reference formulation, and cell viability measured alongside the response |
Read expression alongside viability because changes in viable cell number can affect the measured signal and candidate ranking. Keep conclusions specific to the tested model, dose, and conditions, because performance in one assay does not establish performance in other models or in vivo.
Select formulations that meet your screening criteria
Set screening criteria around the intended cargo, the requirements of downstream assays, and the reference formulation used for comparison. Defining those criteria before reviewing results keeps candidate selection focused on the application, rather than whichever readout appears most favorable.
When candidates perform well on some readouts but fall short on others, the pattern across the results points to whether the candidate should advance, be repeated, or be investigated further.
| Pattern | What it indicates | Next step |
|---|---|---|
| All criteria met | The candidate is ready for the next stage of testing | Advance it with replicate counts and conditions recorded |
| High encapsulation efficiency with low recovery | Most measured cargo is encapsulated, but too little may remain for planned assays | Trace where material is lost during collection or processing, then repeat |
| Particle characteristics in range with high variability across preparations | Individual samples pass, but the result has not yet proven repeatable | Add independent preparations and review sample handling |
| Similar particle and cargo results with different expression | Functional differences that particle and cargo readouts alone do not explain | Advance the stronger candidate and confirm the difference in a repeat assay |
| Strong expression with reduced viability | Cell loss may be affecting both the signal and the candidate's suitability | Repeat across a dose range to see whether both criteria can be met |
Candidates that advance should carry their process and measurement conditions with them, so the next stage of testing starts from a documented comparison.
Evaluate the LNP Screening Array
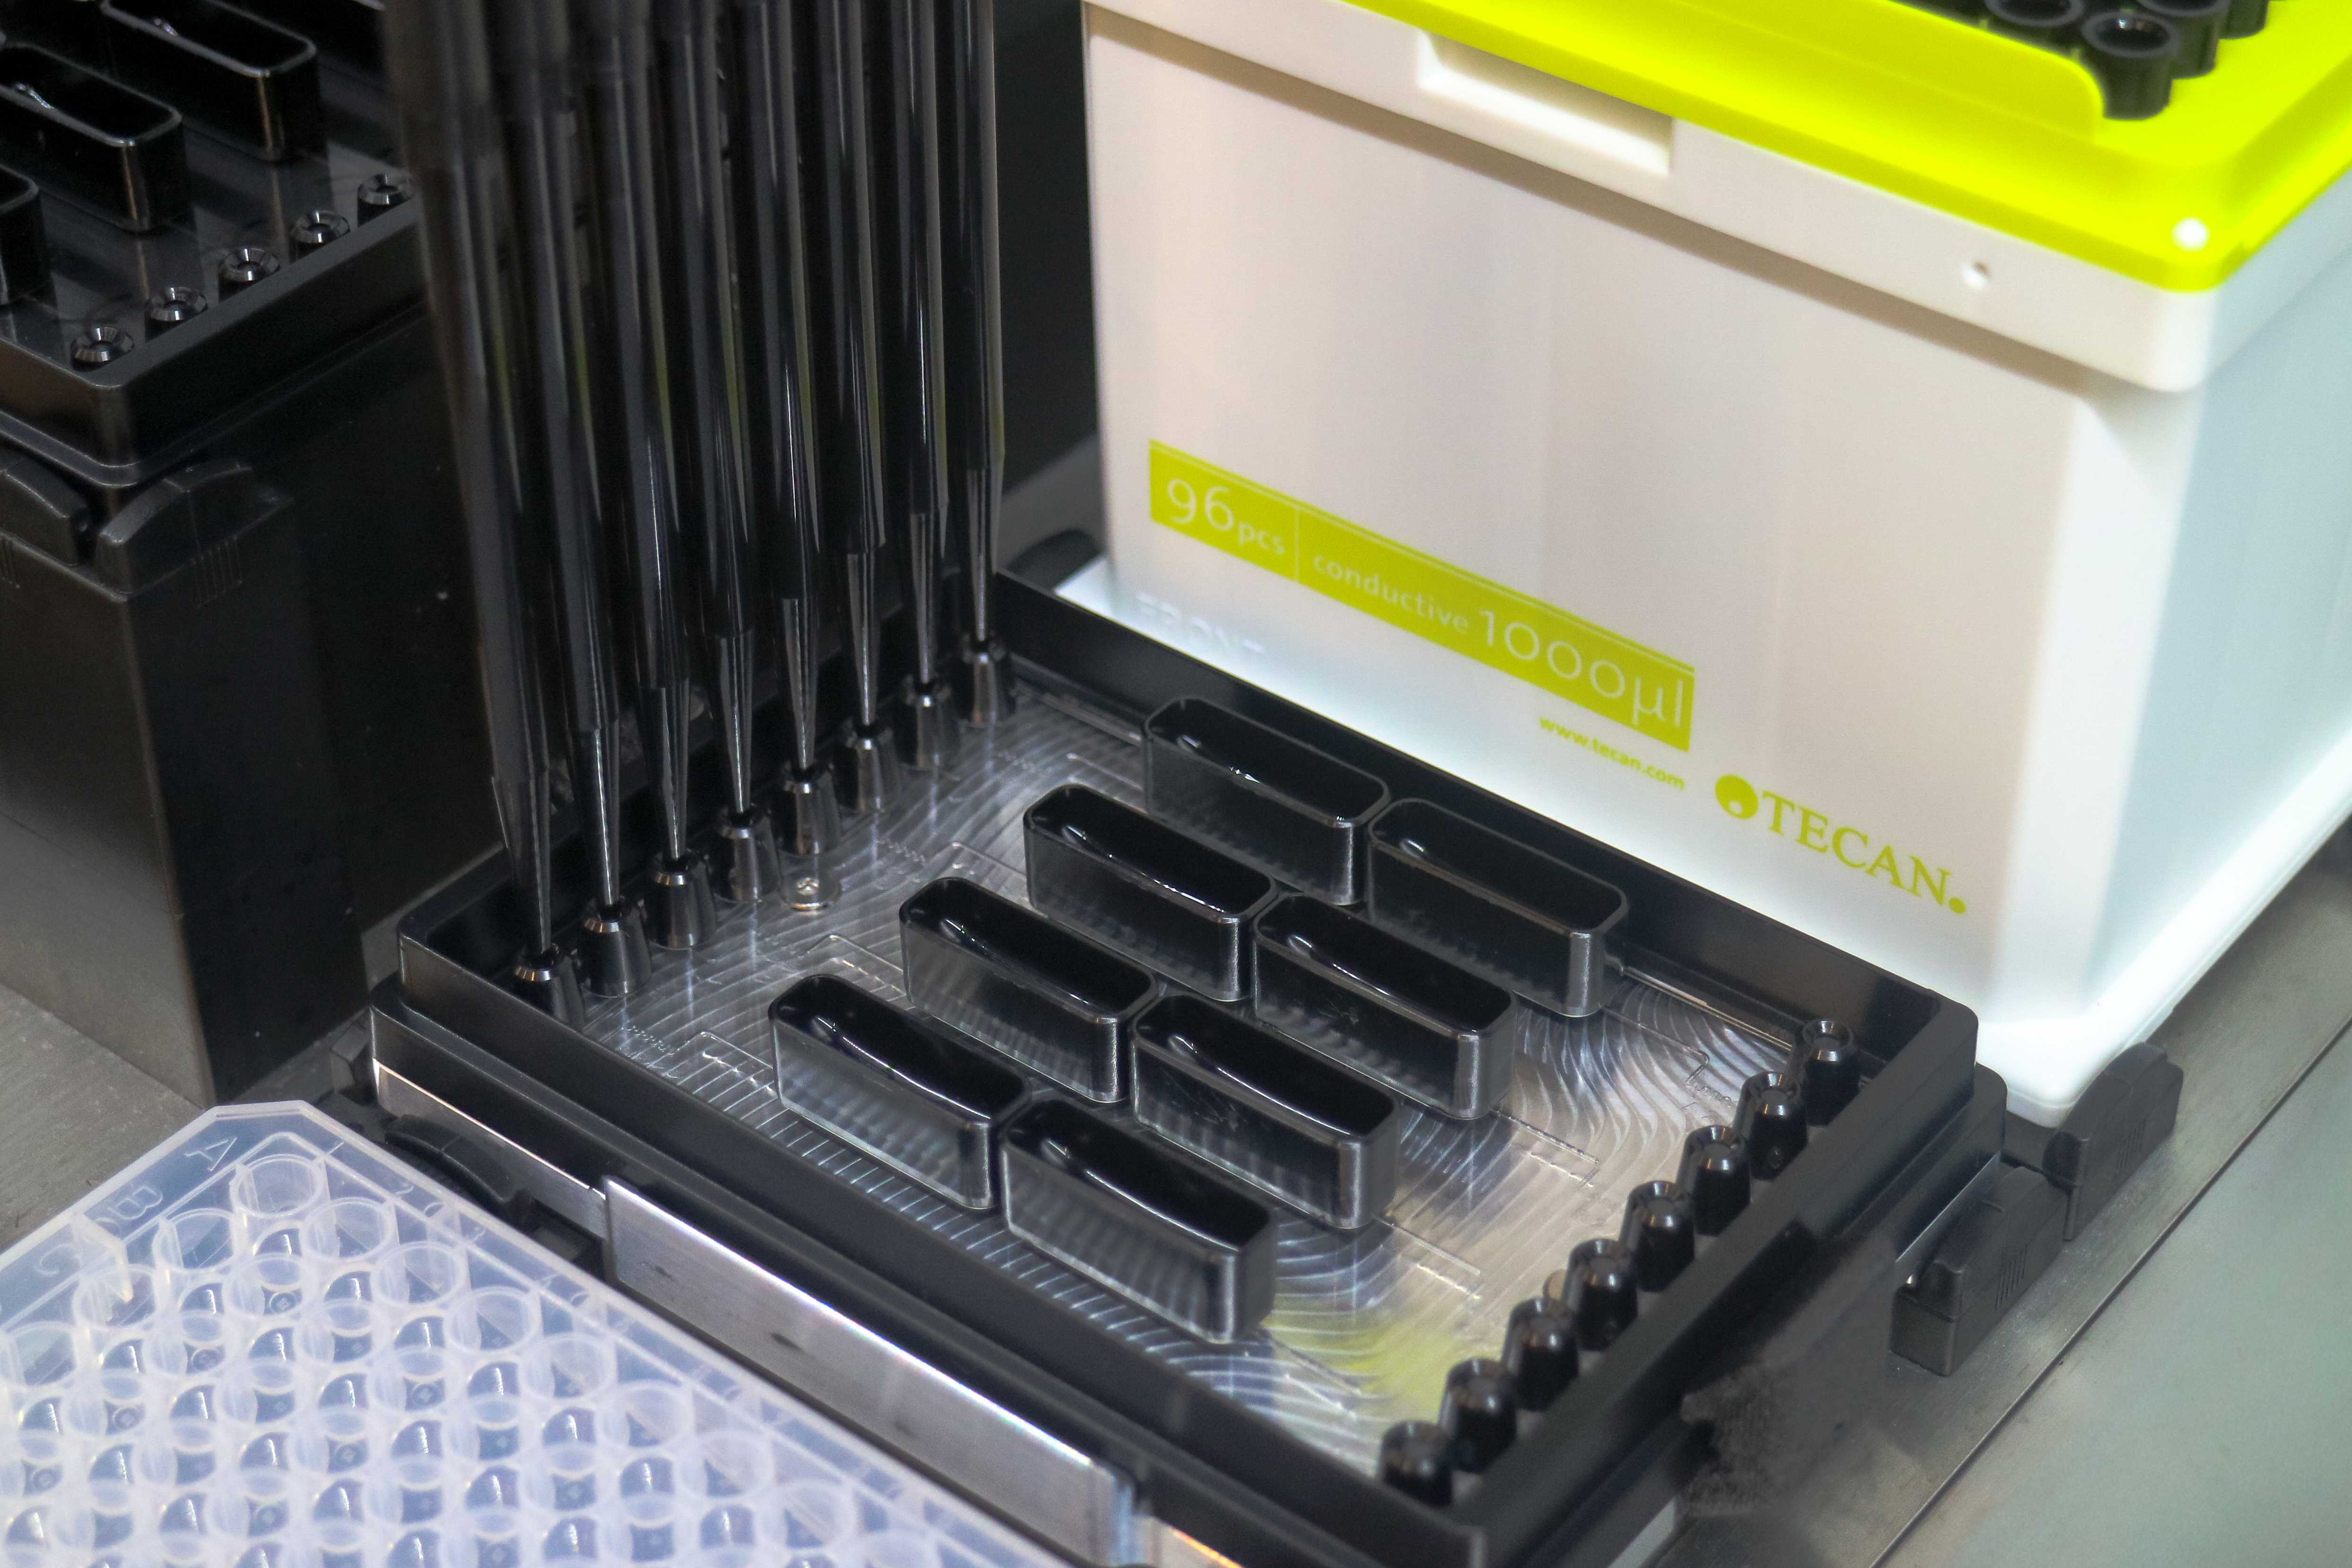
The LNP Screening Array transforms your liquid handler into an LNP screening platform. It brings microfluidic formulation onto the deck in a standard SLAS microplate format, so reagent delivery, mixing, and sample collection stay within the automated workflow.
| Screening step | How the LNP Screening Array supports it |
|---|---|
| Particle size and PDI | Blank LNPs made with an SM-102 lipid mix were characterized below 60 nm Z-average diameter and below 0.15 PDI |
| Independent preparations | Z-average %CV stayed below 3% under those conditions, and each formulation is generated in seconds, so extra preparations add little time |
| Cargo recovery | Less than 50 µL dead volume per formulation helps preserve limited lipids and cargo for downstream readouts |
| Consistent preparation | A platform-specific automation protocol runs every candidate through the same programmed steps |
| Biological testing | Formulated LNPs collect directly into plates for downstream characterization and biological assays |
Evaluate reproducibility with your own formulations
Evaluations run in your lab on your liquid handler, with success criteria you set against your current method.